In retail and e-commerce industries, customers can share their experiences after making purchases in a certain platform. Their reviews usually can also be seen by other customers. Customers might not decide whether to buy a product before seeing other customers’ review first. Thus, review can be considered as one way for customers to express their view as a platform’s user to the other users.
A review does not only describe the product, the service, and the transaction experience, but also the behaviour of the customer him/herself. Getting know about customers would be a good step to know their painpoints and whether those affect their behaviour.

Source: bbcgoodfood.com
Consider the most prominent aspect of a review: rating (e.g. rating that describes how satisfied you are in a 1-to-5 star range). In terms of writing reviews, there are some behaviours that can be empirically expected from customers. If a seller offers a certainly bad product or service then someone buys his product and gives bad review, the upcoming reviews tend to be similar.
Let’s see another case. If a buyer gets a bad experience purchasing from a certain seller, either it is about the product or the service, will the upcoming reviews from the same buyer but for other different sellers be similar? Suppose that someone has given 1-star rating for a purchase. What is the probability that he gives another 1 star for his next purchase? Or what is the probability of him giving another star?
How does a previously given review affect another upcoming review by the same person?
Given a bunch of users’ transaction historical data, we can extract review history from each customer. As a dummy example, we’re using a public dataset which contains orders made at a Brazilian e-commerce.
With few data manipulation steps, we can track the reviews has been given by a customer.
| |
review_id |
order_id |
customer_unique_id |
review_score |
review_answer_timestamp |
| 0 |
13359… |
e22ac… |
000036… |
5 |
2018-05-21 13:44:48 |
| 1 |
e383e… |
3594e… |
0000b8… |
4 |
2018-05-11 22:29:25 |
| 2 |
d89cb… |
b33ec… |
0000f4… |
3 |
2017-04-07 01:19:44 |
| 3 |
6f22e… |
41272… |
0000f6… |
4 |
2017-11-03 00:17:51 |
Based on the dataset description, each customer was sent a survey after finishing a particular transaction which could be filled by rating and review description. Ratings are in 1-to-5 range.
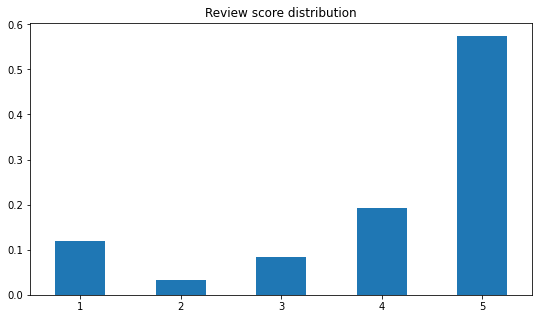
In overall, most given rating are 5-star, followed by 4-star and 1-star. Customers would either give a very good or a very bad review.
We’ll just simplify the previous table to something looked like this.
| |
customer_unique_id |
nth_review |
review_score |
| 0 |
000036… |
1 |
5 |
| 1 |
0000b8… |
1 |
4 |
| 2 |
0000f4… |
1 |
3 |
| 3 |
0000f6… |
1 |
4 |
Now we can see the order of each review given by every customer.
From this summary, we can calculate a probability defined as
\[P(X_{t+1} = i_{t+1} | X_t = i_t) = \frac{P(X_{t+1} = i_{t+1} \cap X_t = i_t)}{P(X_t = i_t)}\]
This equation tells us the probability of someone giving \(i_{t+1}\)-star rating given he/she gave \(i_t\)-star rating in his/her previous purchase at a certain time \(t\). Here, \(i_{t+1}\) and \(i_t\) can be the same or different number.
We would like to model this with a collection of stochastic processes called Markov chain. Think stochastic process as a family of random variables. One type of stochastic process we might more often see is time series.
Markov chain holds a property defined as
\[P(X_{t+1} = i_{t+1} | X_t = i_t) = P(X_{t+1} = i_{t+1} | X_0 = i_0, X_1 = i_1, ..., X_t = i_t)\]
What the line above says is “the upcoming review is only affected by the latest review”. In real life, we may think that someone’s reviewing behaviour need to be observed from his/her whole review history. But in Markov chain, we’ll assume that only the last given review will affect the next upcoming review. So observing his/her whole review history and the latest review only will be considered the same.
Markov chain tells us the probability of transitioning from a state to the other state at a certain time. We consider “giving a \(i_{t}\)-star rating for \(t^{th}\) transaction” as our state here. So “giving a \(i_{t+1}\)-star rating after giving a \(i_{t}\)-star rating” is the transition we’re talking about.
For every rating a customer has given, we need to know the previous rating he/she had given. So, we’ll put one more variable called prev_review_score for each review_score from a customer.
| |
customer_unique_id |
nth_review |
review_score |
prev_review_score |
| 0 |
000bf… |
2 |
4 |
5 |
| 1 |
00172… |
1 |
4 |
4 |
| 2 |
00428… |
2 |
5 |
5 |
| 3 |
004b4… |
2 |
5 |
1 |
For an illustration purpose, shown above are reviews made by customers after their first review ever. So it looks like every review_score always have prev_review_score, while actually the first review from every customer wouldn’t have their respective prev_review_score (represented by NaN).
We’ll use these two terms to calculate the probability of making a transition like defined above. After calculate the probability of each possible transition, then we can put them to a transition matrix like this.
| |
1 |
2 |
3 |
4 |
5 |
| 1 |
0.551 |
0.030 |
0.083 |
0.090 |
0.247 |
| 2 |
0.099 |
0.397 |
0.124 |
0.132 |
0.248 |
| 3 |
0.095 |
0.030 |
0.409 |
0.201 |
0.265 |
| 4 |
0.084 |
0.017 |
0.094 |
0.507 |
0.298 |
| 5 |
0.061 |
0.016 |
0.033 |
0.073 |
0.817 |
From this matrix, we can see the probability of a someone transitioning from \(i^{th}\) state to \(j^{th}\) state, where \(i\) is the row number and \(j\) is the column number. Both \(i\) and \(j\) represents a star rating.
In order to gather cool insights easier, we can visualize these probabilities with this directed graph.
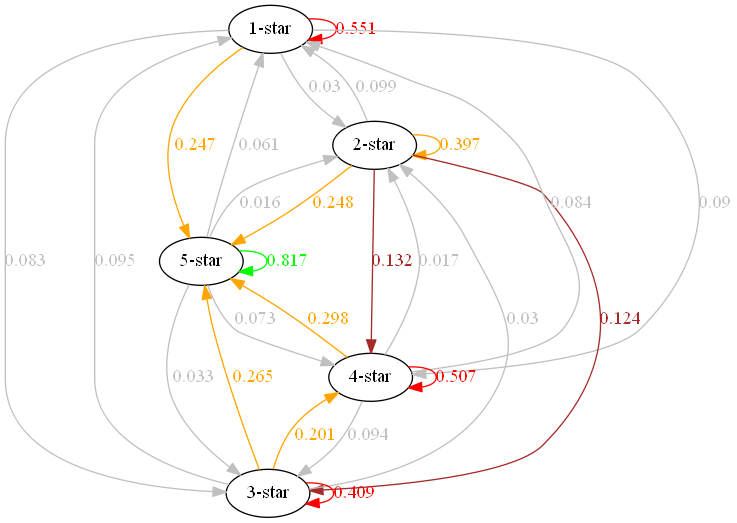
Some interesting notes from this graph.
- Customers have at least 39.7% probability of giving the same rating as their previous rating
- Customers who gave 5-star rating have 81.7% probability of giving another 5-star
- Customers who gave 1-star rating have 55.1% probability of giving another 1-star
- Customers have about 25 - 30% probability of giving 5-star rating given they gave any rating beside 5-star
And one more cool stuff. With the same transition matrix, we can do a matrix exponentiation defined as
\[{P^{(k)}_t} = \begin{pmatrix}\mathbb{P}(X_{t+k} = 1 | X_t = 1) & \mathbb{P}(X_{t+k} = 2 | X_t = 1) & \cdots & \mathbb{P}(X_{t+k} = n | X_t = 1)\\\ \mathbb{P}(X_{t+k} = 1 | X_t = 1) & \mathbb{P}(X_{t+k} = 2 | X_t = 1) & \cdots & \mathbb{P}(X_{t+k} = n | X_t = 1)\\\ \vdots & \vdots & \ddots & \vdots\\\ \mathbb{P}(X_{t+k} = 1 | X_t = n) & \mathbb{P}(X_{t+k} = 2 | X_t = n) & \cdots & \mathbb{P}(X_{t+k} = n | X_t = n)\end{pmatrix}\]
We can use this notation to see the probability of someone giving \(i\)-star rating after \(k\) transactions given he/she gave \(j\)-star at his first transaction. We’d like to see how the customer’s behaviour in a long run.
Let \(k\) be 20, which is a quite large number of purchases made by an individual. The transition matrix after 20 steps will look like this.
| |
1 |
2 |
3 |
4 |
5 |
| 1 |
0.134 |
0.031 |
0.083 |
0.155 |
0.597 |
| 2 |
0.134 |
0.031 |
0.083 |
0.155 |
0.597 |
| 3 |
0.134 |
0.031 |
0.083 |
0.155 |
0.597 |
| 4 |
0.134 |
0.031 |
0.083 |
0.155 |
0.597 |
| 5 |
0.134 |
0.031 |
0.083 |
0.155 |
0.597 |
(note: As \(k\) gets larger, probabilities in each column tend to converge to the same number.)
After a lot of purchases, the probability of giving 5-star rating is higher, regardless what star he/she gave in his/her first purchase.
By seeing these, given that the other variables are staying put, we get an overview approximation on how our customers are on our platform.
With these such simple assumptions and also data preparation, it turns out that Markov chain can be a quite powerful model for us to explain a certain phenomenon like this review behaviour problem.

Source: tenor.com
If you find this model interesting, there’s a very cool lecture from MIT OpenCourseWare which talked about Stochastic Processes (skip to 32:24 for the Markov chain explanation). You can also read this article from Brilliant to get a little bit of initial exposure on this model. If you prefer an interative one, see this blog post by Victor Powell and you can play with some Markov chain visualization.